
圖文:康恩宇(Robert Midence)/生醫所博士生
From a pharmacological perspective, the most classic version of a dose-response experiment would be the determining of a drugs effect on a biological system, like cells grown in vitro. But even a complex situation like this can be analyzed with the relatively simple approach of plotting X against Y values. Fortunately, this mathematical model is one of GraphPad Prism’s specialty. Today we will learn some of the basic concepts of Dose-Dependent responses, as well as a simple way to graph and analyze them using the GraphPad Prism software.
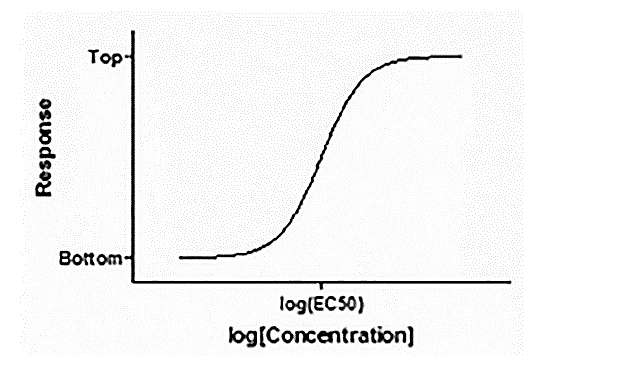
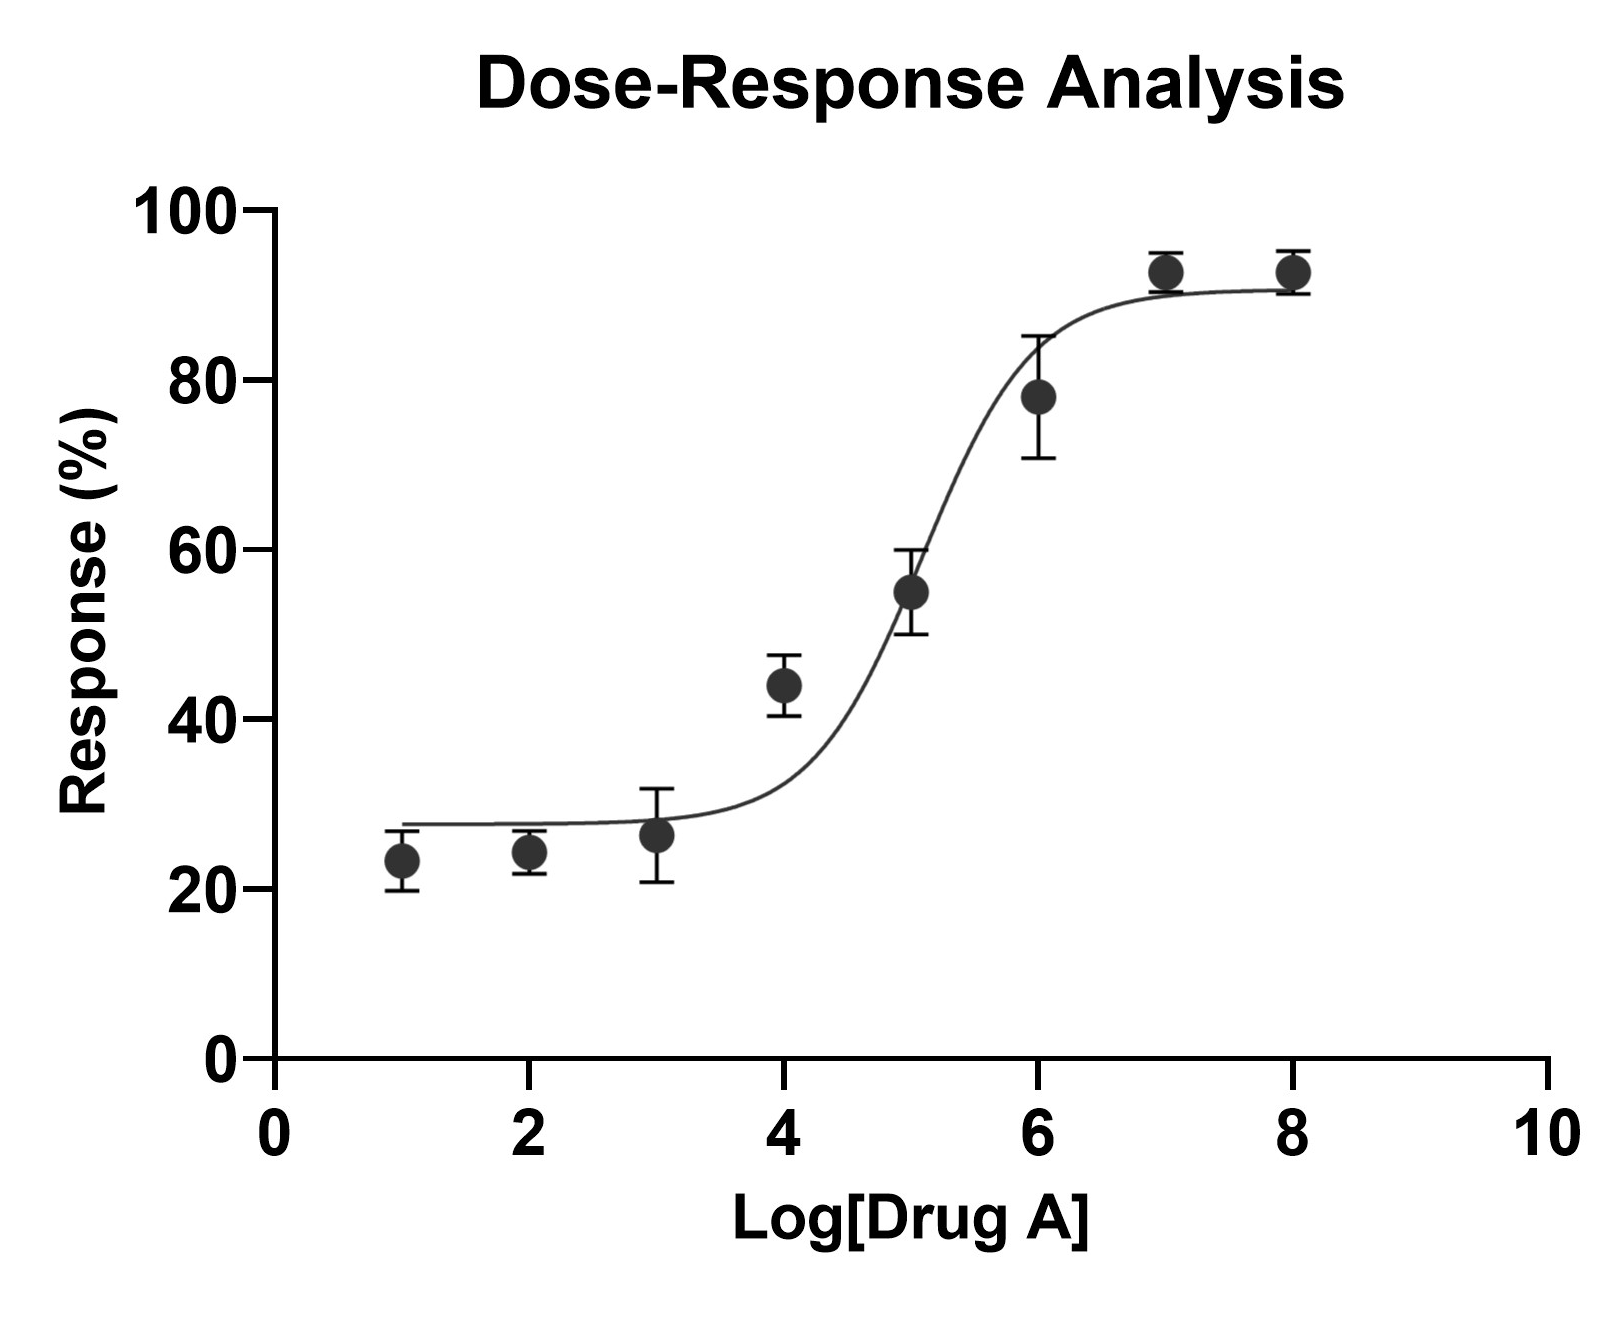
In a dose-response curve, the X values represent the drug concentrations or a function of concentrations (like the logarithm of concentrations) and the Y values represent the response that is under question. Plotting these value usually results in a sigmoidal curve (or the dose-response curve) with a bottom and a top flat section, or “plateaus”. Once the experiments have been performed, the data obtained and the curve plotted, a plethora of statistical analyses can be ran on to obtain greater insight on study, like the famous EC50 and IC50 values. But before we do that, let us dive a little deeper into the theory behind this analysis.
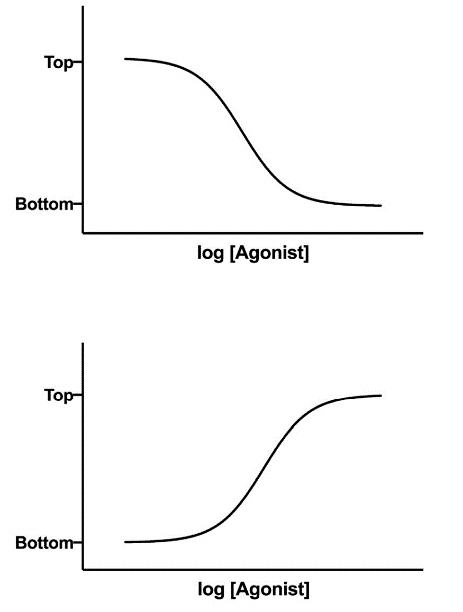
As mentioned before, Y values are the responses measured at that dose (concentration) of the drug in question. Said response can result in a downward sigmoidal curve or an upward sigmoidal curve, representing the effect that the drug has on the system. Additionally, Y values can be transformed into different units by multiplying or dividing by the appropriate constant. For example, you may measure the fluorescence of a sample, but would like to plot in concentration units. The assay used will probably illustrate the relationship between the amount of fluorescence generated and the concentration of the target, allowing you to convert simply by dividing by a constant.
To obtain a more accurate representation, it is usually recommended to plot 5-10 concentrations distributed across the curve, so that you obtain the values that for the upper and lower “plateaus” as well as the transition between both of them. If your concentrations are very separated from each other, applying the logarithmic function to concentrations will allow better visualization of the shape of the curve by reducing dispersion of the data.
Now that we’ve discussed the basic theory behind dose responses, lets apply them to GraphPad Prism.
Prism Time
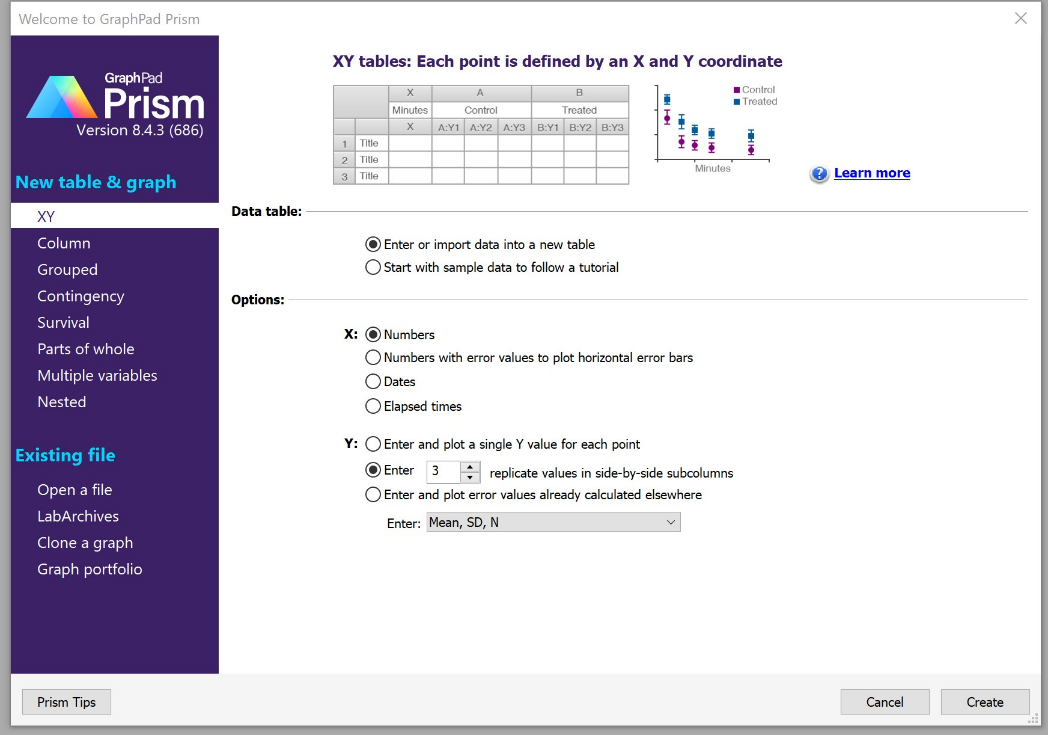
Step 1. Start
Create an XY table, and enter data. If you have replicate Y values at each X value, format the table for entry of replicates. You can use the following screenshot as a reference:
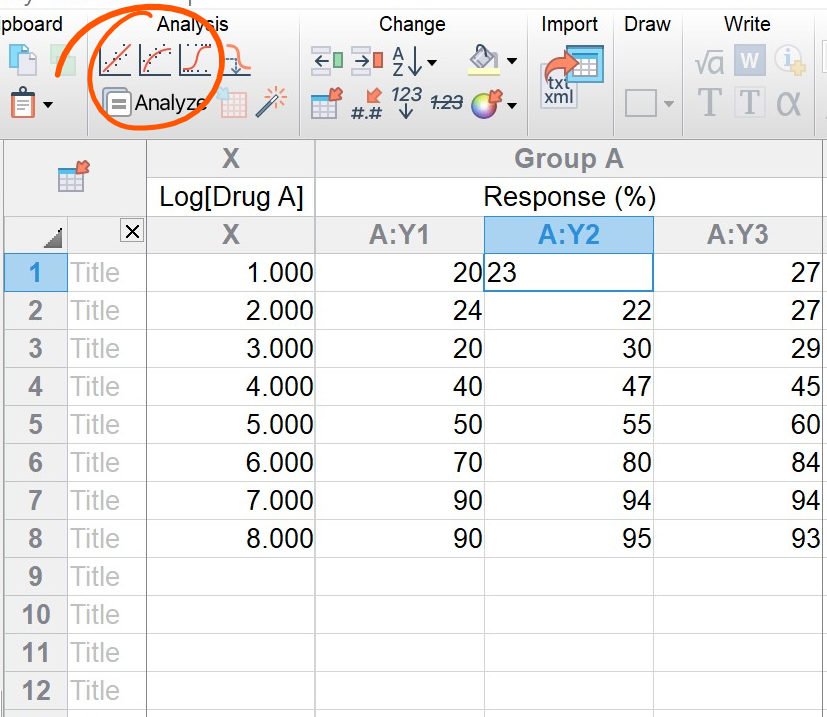
Step 2. Enter Data
In the XY table, enter all your data values and label the axes appropriately. Once you are done, on the upper left corner, click the shortcut button to fit a model with nonlinear regression.
Step 3. Choose a model
In the Nonlinear regression window, select a model that fits your data. In this example, we will use the most standard logarithm of an agonistic agent versus response. Use the following screenshot as reference.

Further Analysis
Nonlinear regression can determine a drug’s potency (EC50 or IC50), find best-fit values, compare results from different experiments and interpolate unknowns from a standard curve. Keep in mind that biological systems are very complex and non-linear regression analysis may not fully characterize the dose-response relationship. That said, values like EC50 or IC50 give us a deeper understanding of the potency of the drug in question.
The Relative EC50/IC50 Value
EC50 (effective concentration) is the concentration of drug that elicits a response halfway between the baseline and maximum response. IC50 (inhibitory concentration) is the concentration of a drug that elicits a response halfway between the maximum response and the minimum response, in downward-sloping dose-response curves. Both of these values are influenced by a drug’s affinity and efficacy.
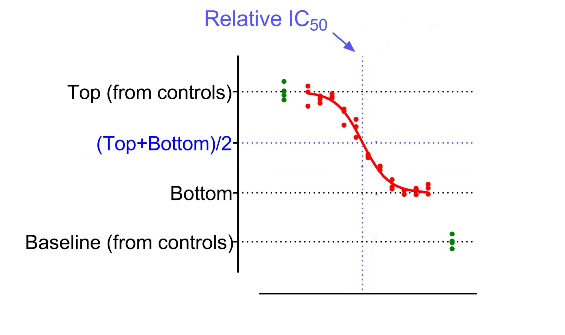
Even though there are different ways to calculate these values, the Relative EC50/IC50 is by far the most common definition, and is usually what people mean by "the EC50/IC50" of a response. It is the concentration required to bring the curve down to a point halfway between the "Top" and "Bottom" plateaus of the curve, as shown in the diagram to the right.
The EC50 (or IC50) should be within range of your data, near the middle of the curve. If these values are not appropriate, it might be useful to constrain some of the parameters. Additionally, check that plateaus of your data are reasonable. The maximum plateau should not be considerably higher than your highest data point.
Error Calculation
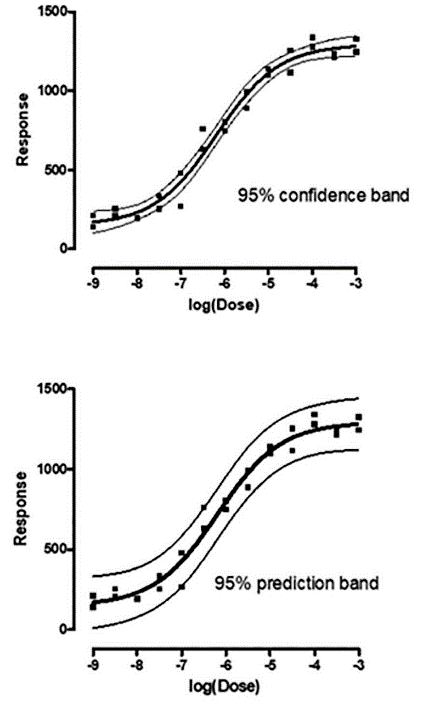
GraphPad Prism can also help you calculate the error of your data. For instance, the 95% confidence interval means you can be 95% confident that the true curve falls inside that range.The narrower the confidence band, the better. Standard error is particularly important in the calculation of 95% confidence intervals. Another parameter is the 95% prediction band, which represents the idea that 95% of future results (if you were to perform the same experiment again) would fall within that interval. The 95% confidence band is usually narrower than 95% prediction band.
GraphPad Prism is an extremely powerful tool that can help you deal with most, if not all, of the data commonly found in a biomedical experiment. It has so many options that sometimes it can be daunting to learn the hangs of it, but the more you invest in understanding it, the more you will get out of it, and when stuck, you can always reach out to someone for help! Good luck!
歡迎大家多多利用,如有使用及安裝問題,請洽練小姐(TEL: 02-27899839);也歡迎各位分享使用心得,有意願分享者,請洽郭小姐(TEL: 02-27899840)。